The pipeline was green. The numbers were wrong.
How to add data quality checks that catch the failures nobody gets paged for
The pipeline was green. Every task succeeded. The run took the usual eleven minutes.
Then someone from finance asked why yesterday's revenue was 3.2 million when the source system said 2.9 million.
Nothing had failed. That was the problem. A partner had started sending amounts in cents instead of dollars for one region. The rows were valid. The types were correct. The schema had not changed. Our pipeline did exactly what we told it to do, which was to move numbers without ever asking if the numbers made sense.
This is the most expensive kind of failure in a data platform, because it does not look like a failure. It looks like a report.
Green means "the code ran", not "the data is right"
A task status tells you the machine finished its work. It says nothing about the meaning of what passed through.
Most pipelines only check for things that break the engine: a missing file, a bad cast, a wrong column count. Those failures are loud, and loud failures are easy. Someone gets paged, someone fixes it, trust survives.
Quiet failures are different. Duplicated orders after an upstream retry. Nulls in a customer id that was never supposed to be null. Amounts a hundred times too large. A category value nobody has seen before. A day where the row count quietly drops by 40 percent because a partner file was half written.
None of that stops a job. All of it reaches a dashboard.
If nobody wrote down what "correct" means, the pipeline cannot defend it.
Write the rules down before you write the checks
The hard part of data quality is not the code. It is the sentence.
Sit with the person who uses the table and finish these sentences out loud:
An order id is never null and never repeats.
An order amount is always greater than zero and, for us, never above fifty thousand.
An order status is one of five known values.
Every order belongs to a customer that exists in the customer table.
A normal day has between eight hundred and two thousand orders.
Five plain sentences like that will catch more real incidents than a monitoring tool you never configured. Once the sentence exists, turning it into a check is the easy part.
Four kinds of checks that cover most incidents
Row level checks ask if a single row makes sense. Not null, positive amount, valid status, sane date range.
Set level checks ask if the whole batch makes sense. Row counts inside a normal range, distinct key counts matching row counts, no duplicate business keys.
Relationship checks ask if the row fits the rest of the warehouse. Every foreign key resolves. Every order maps to a real product.
Trend checks ask if today looks like the recent past. Today's total is within a reasonable band of the last seven days. The null rate did not jump from 0.1 percent to 12 percent overnight.
Row level checks catch bad records. Trend checks catch bad days. You need both, because a file that arrives empty passes every row level rule ever written.
Decide what happens to a bad row
This is the decision most teams skip, and it is the one that matters.
You have three honest options for a failing row, and each is right in different places.
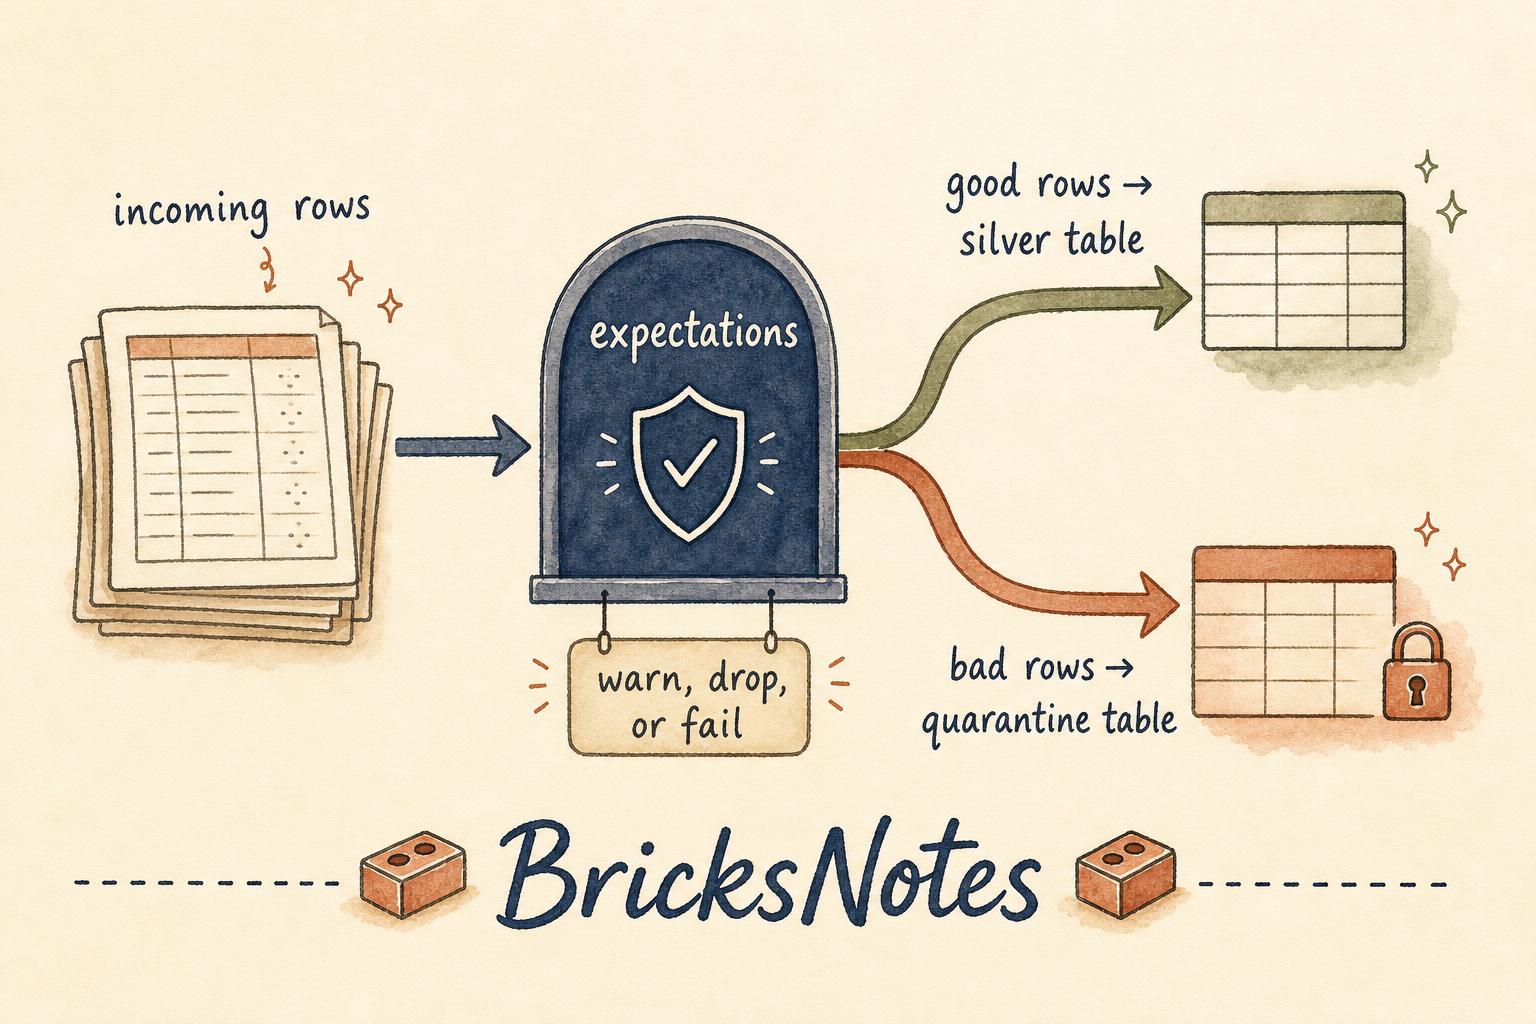
Warn. Let the row through, record that it broke a rule. Good for bronze, where the job is to keep the raw truth, including the ugly parts.
Drop and quarantine. Keep the good rows moving, write the bad rows to a separate table with the reason attached. This is the default we would recommend for silver. Downstream tables stay clean, and nothing is lost. Somebody can look at the quarantine table on Monday and ask the partner what happened.
Fail the run. Stop everything. Reserve this for rules that would make the output actively wrong or unsafe, like a duplicated primary key in a table that feeds billing.
Silently dropping rows with no quarantine table is the worst of the three. Your numbers get quietly smaller and nobody can explain why.
Doing it in Databricks Free Edition
You do not need a special tool to start. Two features in the platform cover most of it.
Table constraints live on the Delta table itself, so they apply no matter who writes to it. This is the strongest form of protection because it does not depend on anybody remembering to run a check.
ALTER TABLE workspace.default.orders_silver
  ADD CONSTRAINT amount_positive CHECK (order_amount > 0);

ALTER TABLE workspace.default.orders_silver
  ADD CONSTRAINT status_known CHECK (order_status IN ('placed','paid','shipped','returned','cancelled'));
A write that violates a CHECK constraint fails. That is deliberate. Constraints are for the rules you never want bent.
Expectations in Lakeflow Declarative Pipelines are for the rules you want measured. You declare them next to the table definition, and the pipeline tracks pass and fail counts on every run.
import dlt
from pyspark.sql import functions as F

@dlt.table(name="orders_silver")
@dlt.expect_or_drop("order_id_present", "order_id IS NOT NULL")
@dlt.expect_or_drop("amount_positive", "order_amount > 0")
@dlt.expect("amount_plausible", "order_amount < 50000")
def orders_silver():
    return (
        dlt.read_stream("orders_bronze")
        .withColumn("order_amount", F.col("order_amount").cast("double"))
    )
Read those three lines as a sentence. Rows without an order id get dropped. Rows with a non positive amount get dropped. Rows above fifty thousand still pass, but the pipeline records how many, so you can watch the number instead of guessing.
If you are working in a plain notebook instead of a pipeline, the same idea in fifteen lines of PySpark:
from pyspark.sql import functions as F

incoming_df = spark.read.table("workspace.default.orders_bronze")

quality_rules = (
    F.col("order_id").isNotNull()
    & (F.col("order_amount") > 0)
    & F.col("order_status").isin("placed", "paid", "shipped", "returned", "cancelled")
)

good_df = incoming_df.filter(quality_rules)
bad_df = incoming_df.filter(~quality_rules | quality_rules.isNull())

good_df.write.mode("overwrite").saveAsTable("workspace.default.orders_silver")
bad_df.withColumn("quarantined_at", F.current_timestamp()) \
    .write.mode("append").saveAsTable("workspace.default.orders_quarantine")

print("kept:", good_df.count(), "quarantined:", bad_df.count())
Notice the isNull in the bad rows filter. A three valued logic mistake there is how bad rows disappear into neither table, which is a quiet failure of your quality check itself.
Make the check visible, or it will not survive
A check nobody looks at is a check that gets deleted six months from now to make a job run faster.
Two habits keep quality alive. First, write the pass and fail counts somewhere every run, even if that place is a small pipeline_quality_log table with the run time, rule name, and counts. Second, look at that table when a number is questioned, before you look at the code. Nine times out of ten the answer is already in it.
That is also the difference between a pipeline that works and a pipeline that is trusted. Trust is not built by never being wrong. It is built by being able to say, quickly and precisely, what came in, what was rejected, and why.
The mindset shift
Beginners write pipelines that move data. Working engineers write pipelines that make a promise about data, and then prove it on every run.
You do not need a hundred rules. Start with five sentences the business would recognise. Route the failures somewhere you can read them. Watch the counts for a week. You will learn more about your sources in that week than in a month of reading documentation.
The next time a report looks wrong, the goal is not to be sure it is fine. The goal is to know within two minutes whether it is.
Continue learning
- Data quality lesson for expectations and quarantine patterns end to end.
- Schema evolution for the failure mode where the shape changes under you.
- Safe reruns because duplicates are a quality problem long before they are a performance problem.
- Late arriving data for numbers that change after you already reported them.
- Your first data engineering project if you want to build a bronze, silver, gold flow with checks in it tonight.
- DE Associate practice exam to test whether the concepts stuck.